 Kinrox
Part 2: How Our '196 MB' Spotify Player Quietly Grew to 450 MB Overnight—Wait, 168 Dead WebSockets, SwiftUI's Secret Tax, and Why foobar2000's mmap Trick Still Rules
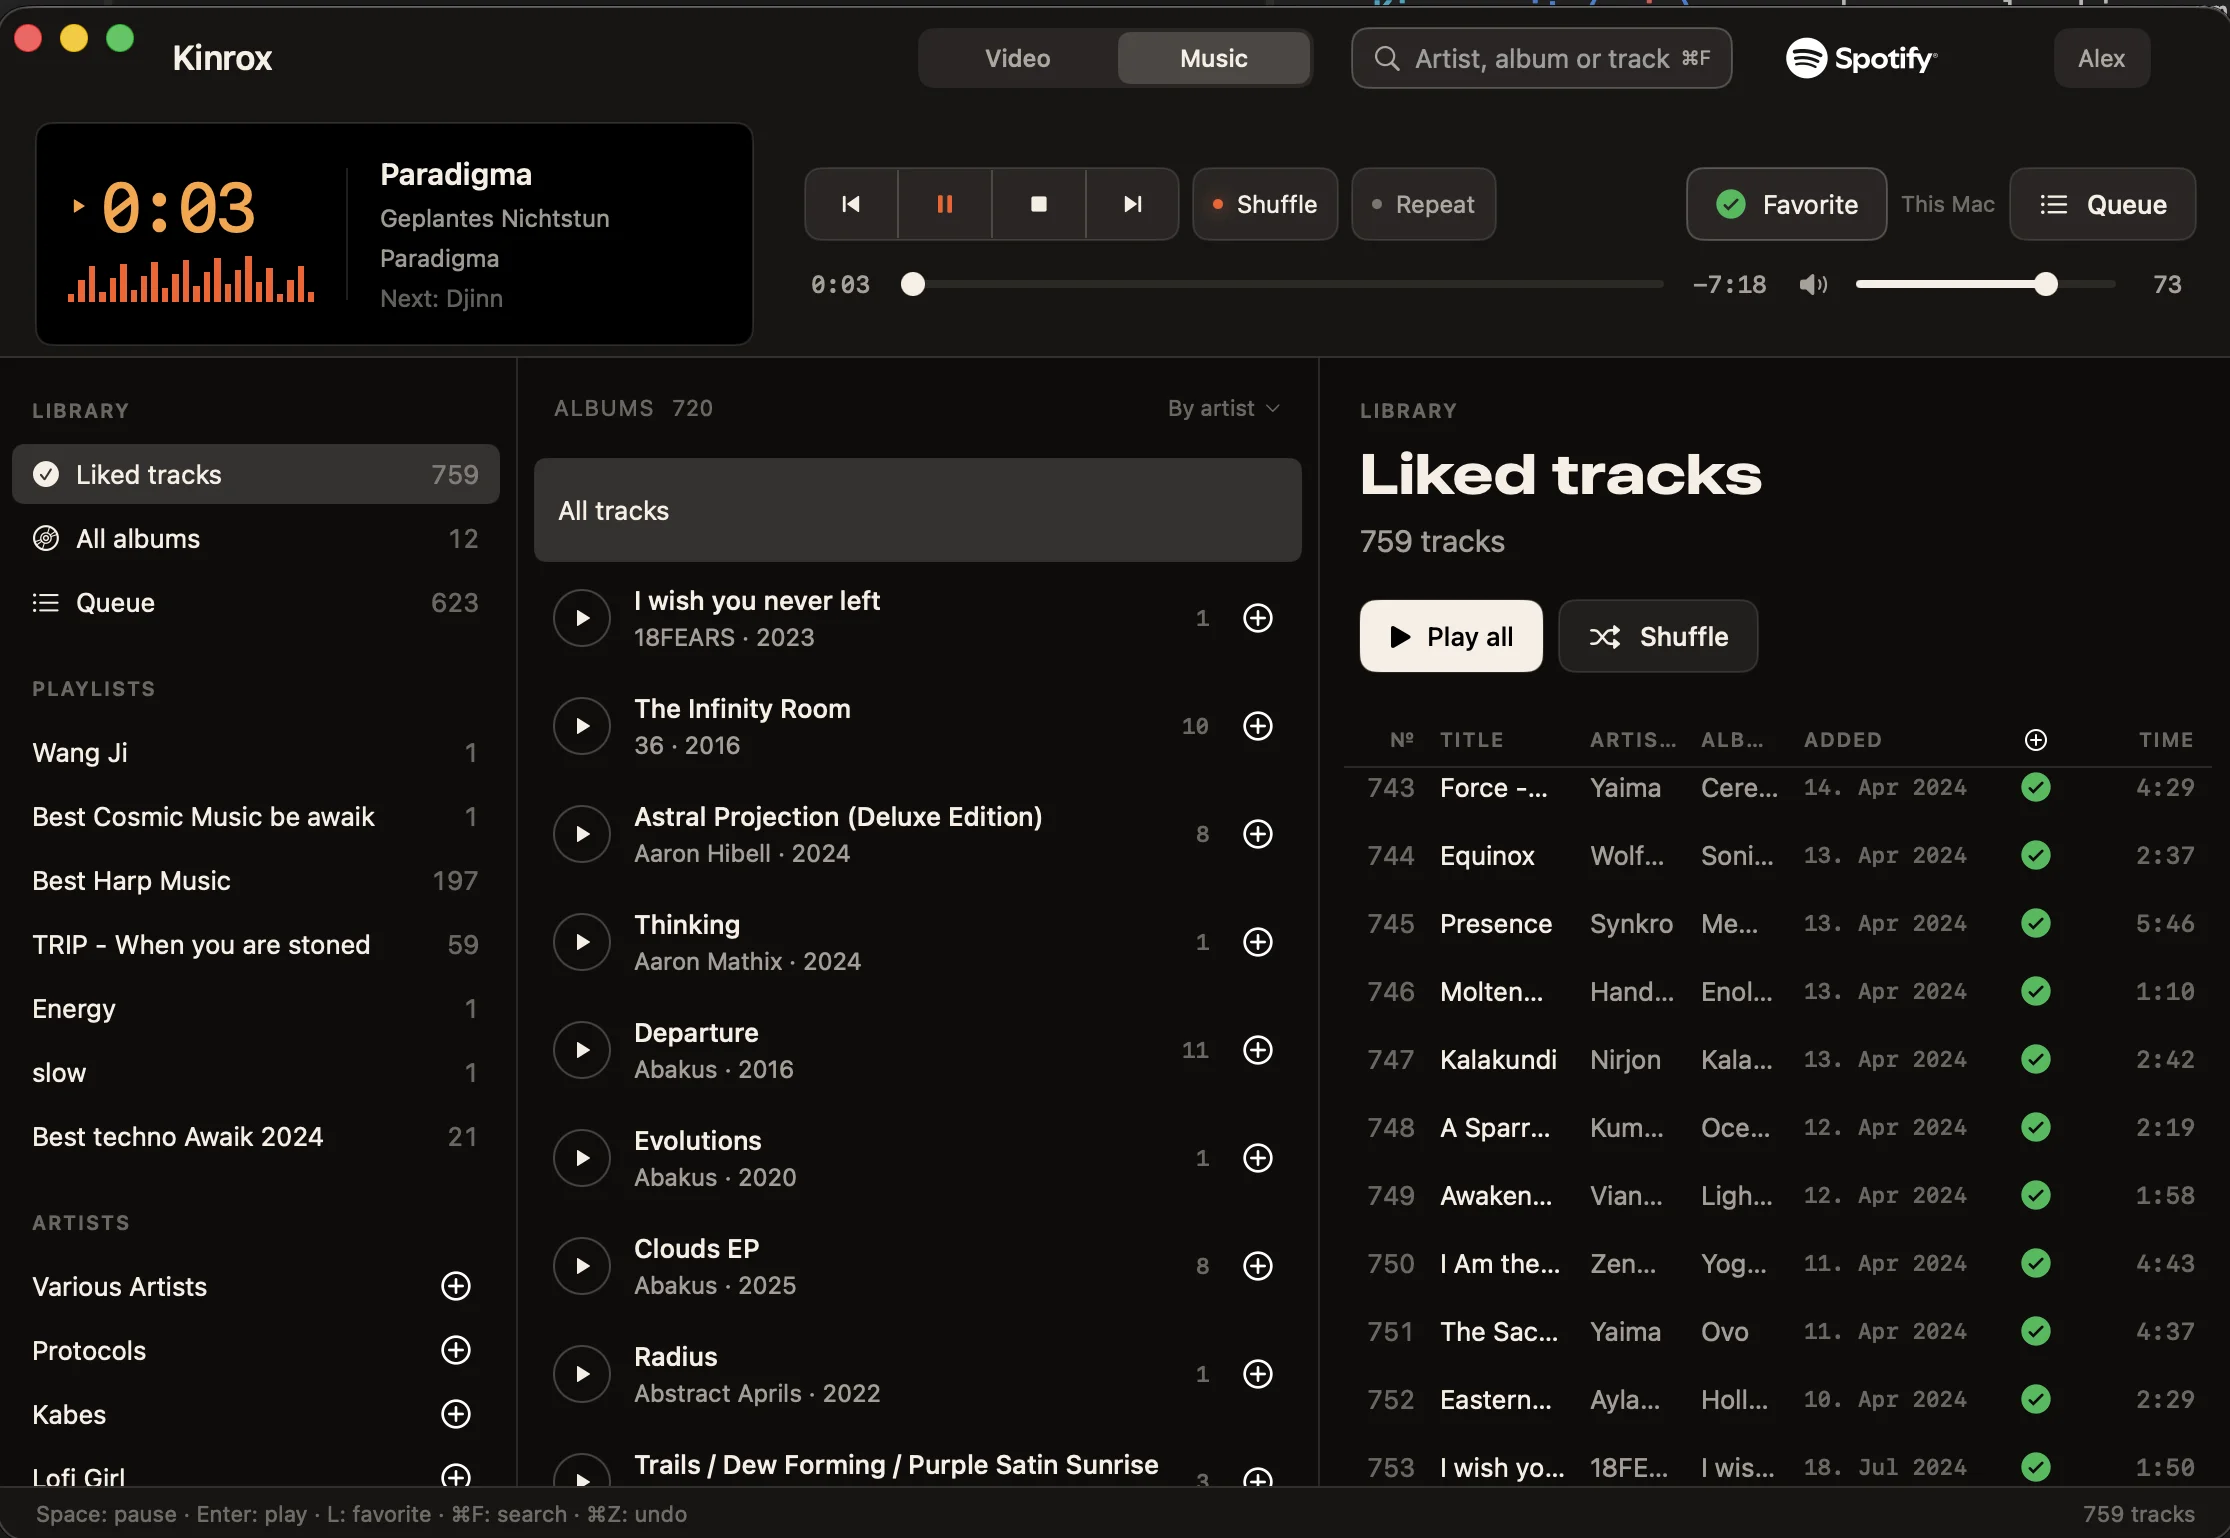
Yesterday, I published Part 1 of the Kinrox story, celebrating victory. We had built a native macOS video and Spotify player in Swift 6 and SwiftUI, replaced the 2 GB Electron-based Spotify.app with Spotify's official headless soloist binary (27 MiB RAM), squashed an eager VStack in the sidebar, and watched Activity Monitor settle at a proud 196 MB.
Champagne corks popped. I plugged my MacBook into the projector, queued up music and playlists, clicked around our new v3 Similar & Discovery engine, and left Kinrox (GitHub) running overnight.
Seventeen and a half hours later, I opened Activity Monitor.
450.75 MiB. With a lifetime peak of 743.1 MiB.
Wait a second. Our entire SQLite music database on disk is a couple of megabytes. The
soloistaudio engine is still sitting politely at29.11 MiB. Our C watchdog reaper (KinroxSoloistHost) is0.92 MiB. Why on earth is the mainKinroxUI process eating 417 MiB after 17.5 hours?!
Even worse: when we ran macOS's leaks tool against the live process (PID 45801), it proudly reported: 2 leaks totaling 112 bytes.
Let that sink in. Not 112 megabytes—112 bytes. According to leaks, our app was squeaky clean. Yet over 400 MiB of physical RAM was locked up inside our process.
What followed was the most fascinating rabbit hole of the entire project. We dissected how legendary players (foobar2000, Deadbeef, Cog, Audirvana, IINA, mpv) manage memory, took an X-ray of our live process with vmmap and heap, seriously debated throwing SwiftUI out the window in favor of pure AppKit, discovered an operating-system "legal cheat code" (mmap), and caught five completely different memory hogs hiding in plain sight.
Grab some coffee. Here is the full detective story.
First Stop: How Do "Real" Low-Memory Players Do It?
Before touching a single line of code, we asked a basic question: how do cult-classic players manage huge music libraries of 50,000 to 100,000 tracks while using less RAM than a single browser tab?
When you look under the hood of reference players across macOS, Windows, and Linux, their architectures split into four distinct schools:
| Player | Stack & UI | How It Stores & Renders the Library | Typical RAM Footprint |
|---|---|---|---|
| mpv | Pure C, no GUI (OSD only) | Zero library state in memory; only the active file's demuxer and hardware decoder frames | 35–80 MB |
| foobar2000 / DeaDBeeF | C/C++ + native OS table (NSTableView / Win32) | Flat binary index mapped from disk via mmap + aggressive String Interning | 25–50 MB |
| IINA | Swift/AppKit + libmpv | Native NSWindow + CAOpenGLLayer + cell-reusing NSTableView | 90–160 MB |
| Audirvana / Roon | Heavy desktop UI + custom audio engine | Full object graphs in heap + pre-buffered decoded PCM audio in RAM | 300–900+ MB |
Looking at that table, two revelations jump right out.
Revelation #1: Why mmap Is a Legal RAM Cheat Code on macOS
At first glance, "mapping the database into memory (mmap)" sounds like it should *increase* RAM usage. Paradoxically, on Darwin (macOS), proper mmap uses several times less physical RAM than loading Swift/C++ objects into the heap—and changes what the user sees in Activity Monitor's Memory column.
Here is what happens at the XNU kernel level:
- Dirty (Private) Memory vs. Clean (Page Cache) Memory. Whenever your app reads SQLite rows and allocates an array of Swift structs or classes (
[MusicTrack],Stringbuffers, dictionaries) on the heap viamalloc, macOS marks those pages as Dirty / Private Memory. They belong exclusively to your process, count 100% toward your Physical Footprint in Activity Monitor, and if RAM gets tight, macOS has to burn CPU compressing them in theMemory Compressoror swapping them to SSD. - Double Caching with Standard SQLite
read(). When SQLite reads a database using standardread()syscalls, the macOS kernel first caches that disk page in the Unified Buffer Cache, and then copies those bytes into SQLite's private user-space page cache (PRAGMA cache_size). You pay for the same data in RAM twice. - Zero-Copy
mmap(PRAGMA mmap_size). When you enablemmapin SQLite (PRAGMA mmap_size = 67108864;for 64 MB) and shrink SQLite's private heap cache (PRAGMA cache_size = -2000;for 2 MB), the kernel simply maps virtual addresses in your process directly to the file pages in the Unified Buffer Cache. At startup, 0 bytes of physical RAM are allocated. As your app reads pages, the CPU triggers minor page faults, reading 16 KB pages on Apple Silicon straight from NVMe. Most importantly, because those pages match the file on disk byte-for-byte, macOS classifies them as Clean / Purgeable Page Cache—they don't bloat your app's private memory footprint, and if you launch a heavy game or Xcode build, the kernel can evict them in zero microseconds without touching swap.
Revelation #2: String Interning and Why 22-Byte Spotify IDs Defeat ARM64 Swift
Look at how foobar2000 stores 100,000 tracks. If you have 50 albums by the same artist, how many times does foobar2000 store the artist's name or album title in memory? Once, in a deduplicated string pool, while tracks reference it by a 4-byte integer offset.
Now look at how a naive Swift model stores a Spotify library:
- On 64-bit ARM (
arm64), Swift's inlineSmallStringoptimization can hold at most 15 UTF-8 bytes inside the 16-byteStringstruct value. - A Spotify Base62 ID (
4uLU6hMCjMI75M1A2tKUQC) is 22 bytes long. - A Spotify URI (
spotify:track:4uLU6hMCjMI75M1A2tKUQC) is 36 bytes long.
Every single Spotify ID and URI exceeds 15 bytes by just enough to miss SmallString and trigger a separate heap allocation (Swift.StringStorage, rounded up to malloc bucket sizes)! If an album has 15 tracks and you decode each track from JSON independently, all 15 tracks allocate their own separate heap buffers for albumID, albumTitle, artist.id, artist.uri, artist.name, and their own 48-byte [MusicArtist] array buffer—even though they are identical!
Sure enough, when we looked at our heap dump (heap-selected.txt), our catalog had only 488 unique artists, yet there were 3,467 separate Array<MusicArtist> buffers (492 KB) sitting in the heap.
Opening the X-Ray (vmmap & heap): Where Did 417 MiB Actually Go?
Before blaming everything on strings or SQLite, we needed cold, hard numbers from the 17.5-hour process (PID 45801).
Wait—remember how leaks said there were only 112 bytes of leaked memory? Why does leaks say zero when Activity Monitor says 417 MiB? Because leaks only looks for unreachable pointers (malloc blocks with no reference pointing to them). If you accidentally keep objects alive inside an array, a cache, a view graph, or an unclosed network session, leaks sees a valid pointer and says: *"Looks totally intentional to me!"*
When we ran vmmap -summary 45801 and heap 45801, the real picture emerged—and it was wild:
Memory Region / Category (PID 45801) | Footprint / Dirty Size | What It Actually Was |
|---|---|---|
IOAccelerator + IOSurface (GPU / VRAM) | 150.6 MiB (119.6M + 31.0M) | Metal/OpenGL textures, window backing stores, and libmpv CAOpenGLLayer framebuffers |
Shared Memory | 82.0 MiB | WindowServer & CoreAnimation layer surfaces |
MALLOC Active Heap | 75.7 MiB (231,806 blocks) | Live Swift objects, SwiftUI AttributeGraph, caches, and network sessions |
MALLOC Zone Fragmentation | 68.9 MiB (48% fragmented!) | "Swiss cheese" memory pages left behind after a 743 MiB UI spike |
Stacks, .dylib data, SQLite Page Cache | ~39.7 MiB | Thread stacks, system frameworks, and SQLite |
| Total Main Process Footprint | 416.9 MiB | Plus ~33.8 MiB for soloist + reaper = 450.75 MiB total |
That table immediately killed our naive assumptions. And then we scrolled down heap-top.txt—and froze.
Smoking Gun #1: 168 Dead WebSockets Sitting in the Closet
Right in the middle of heap-top.txt, sorted by object count, sat this incriminating cluster:
168instances of__NSURLSessionWebSocketTask(172 KB)169instances of__NSURLSessionLocal(76 KB)169instances ofstd::__shared_ptr_emplace<NWIOConnection>(130 KB)840instances ofNSURLRequestInternal(215 KB,168 × 5)1,009instances ofCFHTTPMessage(280 KB,168 × 6 + 1)1,194serialdispatch_queue_tqueues (153 KB,168 × 7)!
Where did the magic number 168 come from?!
Over that 17.5-hour session, the player had played 168 tracks!
Let's be precise about what the numbers show—and separate observed object counts, source-level cause, and measured effect:
- What
heap-top.txtactually measured: Across those 168 track launches, the direct heap size of thoseURLSession/ WebSocket /NWIOConnection/ queue allocations was only around 1–2 MiB in total—so they did *not* account for the bulk of the 416.9 MiB footprint on their own, but their counts grew strictly in lockstep (168×) with the number of tracks played. - What
SoloistProcessSupervisor.swiftwas doing inv0.5.5(HEAD): In0.5.0, we switchedsoloistto--single-trackmode so it spawns a fresh process for each song and connects over a local WebSocket. On every single track launch,launch()calledURLSession(configuration: settings, delegate: SoloistSocketDelegate(), delegateQueue: nil)—allocating a brand-newURLSessionfor that one song. On teardown,stop()*did* callsocket?.cancel(with: .goingAway, reason: nil)andsession?.invalidateAndCancel()(and nilled out both references), but it did not call(socket as URLSessionTask).cancel()before terminating thesoloistprocess. - Why those objects lingered and how we fixed it: Because the live process wasn't running under
MallocStackLogging,heapalone doesn't give a retain-cycle backtrace insideCFNetworkproving why 168 already-invalidated__NSURLSessionLocaland__NSURLSessionWebSocketTaskinstances remained resident aftercancel(with: .goingAway)andinvalidateAndCancel()raced with local process termination. Regardless, creating and tearing down a freshURLSessionon every song was completely unnecessary. Reusing one sharedURLSessionacross track launches (activeSession(), invalidated only inclose()) and calling(activeSocket as URLSessionTask).cancel()immediately instop()eliminates per-trackURLSessionchurn by construction.
While we were inside SoloistProcessSupervisor, we spotted a second per-track cost: before launching each track, verification read the entire multi-megabyte soloist binary into a Data buffer to compute its SHA-256 hash and spawned /usr/bin/codesign to verify its signature—even when the binary on disk hadn't changed since the previous song 3 minutes ago! Caching a nanosecond-precision lstat() stamp (dev, ino, size, mtime, ctime, btime, digest, hostRequirement)—and verifying that the stamp before and after hashing/signing matches—skips redundant file reads and codesign subprocesses on unchanged binaries while still re-verifying immediately if anything on disk changes.
Smoking Gun #2: Paying the Video Player's GPU Tax While Listening to Music
Next, why was IOAccelerator + IOSurface holding onto 150.6 MiB of graphics memory when we were only listening to Spotify in Music mode?
We checked PlayerRootView.swift and PlayerWindowController.swift:
- On app launch, Kinrox unconditionally initialized
MPVPlayer, its OpenGL render context (MPVRenderContext+ CGL), andVideoLayer(CAOpenGLLayer). - When you switched the top mode picker from
VideotoMusic,PlayerRootViewdidn't unmount the video view—it just set.opacity(0)onPlayerView! - To macOS and CoreAnimation, a
CAOpenGLLayerwith.opacity(0)attached to a liveNSWindowis still a real, full-window Retina OpenGL surface (isAsynchronous = true,contentsScale = 2.0) holding multi-megabyteIOSurfaceandIOAcceleratorframebuffers behind the scenes.
We fixed this cleanly: when session.mode == .music and no video file is loaded (!model.hasMedia && !model.isLoading), PlayerView now unmounts VideoHostView and WelcomeView, and VideoHostView.viewDidMoveToWindow() calls videoLayer.releaseBacking() (frame = .zero, contents = nil) as soon as it leaves the window—freeing the idle OpenGL backing surfaces while keeping mode-switching and traffic-light buttons instant.
Smoking Gun #3: The Big Question—Should We Ditch SwiftUI for AppKit?
Now we arrived at the heart of the investigation: 75.7 MiB of live heap, 68.9 MiB of malloc fragmentation, and that terrifying 743.1 MiB lifetime peak.
Why did the heap spike to 743 MiB during active browsing and leave 68.9 MiB of fragmented "Swiss cheese" pages behind?
The answer is SwiftUI's per-row tax in lists and workspaces:
- In pure AppKit (
NSTableView), if your playlist has 5,000 tracks and your screen fits 30 rows, AppKit creates 35NSTableCellViewinstances and recycles them in a ring buffer as you scroll. - In SwiftUI (
ScrollView+LazyVStack), views are not recycled likeNSTableCellView. As you scroll through hundreds of tracks, expand album cards, or browse Similar & Discovery recommendations, SwiftUI'sAttributeGraphbuilds and retains dependency nodes, layout caches (DisplayList.ViewUpdater.ViewCache.mapalone was 4.87 MiB in our heap dump!), and modifier storage for every realized row.
And we had accidentally made SwiftUI's job 10 times harder in four places:
- Unconditional
.popoverand.helpon every Artist and Album link. In0.5.2, we made the heart button's popover conditional—but inTrackMetadataPopovers.swift, every singleTrackArtistLinkandTrackAlbumLinkin the track table still attached.popover(isPresented:)and.help(...)unconditionally! Even when closed, SwiftUI allocated presentation state (PopoverPresentationModifier,HelpStyleConfiguration) for every visible cell. Worse,MusicViewModel's popover and focus properties lived directly on the root@ObservableMusicViewModel—meaning every link in every row subscribed to the root view model! - Hidden eager
VStacks inside lazy screens. While our mainTrackTableusedLazyVStack, our new v3DiscoveryWorkspaceView.tracksSectionwrapped all recommended tracks inside an eagerVStacknested inside the outer scroll view! And inAlbumsWorkspaceView, expanding an album card rendered all of its tracks inside an eagerVStack. - Two extra copies of the catalog in memory. Whenever
SpotifyLibraryStoresaved updates toSpotifyCacheStore, the cache actor keptprivate var previous: SpotifyCachedLibrary?—a complete second copy ofMusicCatalogandLibrarySnapshotin RAM just to diff what changed on the next SQLite write! Meanwhile, repeated searches and Discovery runs merged disposable tracks and albums intoSpotifyLibraryStore.catalogwithout ever pruning evicted search/discovery items.
At this point, we asked ourselves: Should we throw SwiftUI out and rewrite the UI in AppKit?
Here is the honest engineering math: rewriting the entire app in AppKit would burn weeks of work and break velocity on 90% of the UI (the player chrome, Settings, onboarding, popovers, and the Matrix screensaver) that doesn't have 5,000 rows. Instead, we applied surgical fixes right where the memory went:
- Isolated
@Observablestate (MusicPopoverState&MusicFocusState). We extracted popover and focus state out ofMusicViewModelinto tiny dedicated@Observableobjects (@ObservationIgnoredon the main model), and attached.popoveronTrackArtistLink/TrackAlbumLinkonly whenisPresented == true, plus scoped.helptooltips to hovered rows (hoverHelp). - Replaced every inner
VStackwithLazyVStackinDiscoveryWorkspaceViewand expandedAlbumWorkspaceCardviews. - Switched
SpotifyCacheDatabasetoWAL+ 64 MiBmmap(PRAGMA mmap_size = 67108864,PRAGMA cache_size = -2000) and wrote a zero-intermediate-copy batch streamer (catalogBatches) that reads JSON slices directly from SQLite'smmappointers (sqlite3_column_blob) into framed JSON batch buffers without allocating thousands of[Data?]row arrays. - Replaced
SpotifyCacheStore.previouswithSpotifyCacheSummary—a lightweight dictionary of 64-bitFNV-1aentity digests (~235 KBinstead of a full secondMusicCatalogcopy in RAM). - Added String & Artist Array Interning in
MusicCatalog.merge(so all tracks on the same album or by the same artist share the exact same canonicalStringStorageand[MusicArtist]buffer via Swift copy-on-write) and automatic pruning of disposable search & discovery entities (pruneDisposableCatalog).
Where We Are Now: Before vs. After
All five steps are now live and verified across 362 automated tests (43 in KinroxMusic + 319 in PlayerMacTests):
| Bottleneck Discovered in 17.5h Session | Observed in v0.5.5 Baseline | Structural Change Implemented |
|---|---|---|
SoloistProcessSupervisor per-track session & binary verification | 168 __NSURLSessionWebSocketTask, 169 __NSURLSessionLocal, 169 NWIOConnection, 1,194 serial queues (~1–2 MiB total in heap-top.txt despite session?.invalidateAndCancel() in stop()), plus full binary read + codesign per track | 1 shared URLSession (activeSession(), invalidated in close()), immediate URLSessionTask.cancel(), and nanosecond pre/post-verified lstat() stamp |
Idle VideoLayer OpenGL surface in Music mode | Mounted with .opacity(0) on the main window, holding CAOpenGLLayer / IOSurface buffers | Unmounted when no video is loaded; videoLayer.releaseBacking() frees layer backing on detach |
Duplicate [MusicArtist] arrays & >15-byte Spotify ID/URI strings | 3,467 separate [MusicArtist] buffers for 488 artists; duplicate heap strings per track | Canonical String & [MusicArtist] interning inside MusicCatalog.merge |
| SQLite cache storage & incremental diffing | Standard buffer cache + [[Data?]] row copies + full duplicate SpotifyCachedLibrary in SpotifyCacheStore.previous | 64 MiB SQLite mmap (Clean Page Cache), 2 MiB private cache, streaming catalogBatches, and 64-bit FNV-1a digest diffing |
| SwiftUI rows, popovers & Discovery lists | Unconditional .popover/.help per link, root MusicViewModel observation, eager inner VStack in Discovery & expanded albums | Conditional .popover (if isPresented), .hoverHelp, isolated MusicPopoverState/MusicFocusState, and full LazyVStack |
Live Result After the Changes: About 158 MB Total
On November 8, 2026, at approximately 21:04 (UTC+07:00), we measured the running installation with macOS footprint, including every running Soloist and helper process:
| Process | Physical Footprint |
|---|---|
| Kinrox | 123 MB |
| Soloist and helper processes combined | About 35 MB |
| Combined footprint reported by macOS | 158 MB |
The main Kinrox process had a lifetime peak of 153 MB in this run; that peak excludes Soloist and helpers. The combined current footprint is roughly 65% below the earlier 450.75 MiB observation. This is a live snapshot after the changes, rather than a repeat of the earlier 17.5-hour session under identical conditions: it demonstrates the observed result, not a maximum or a long-session guarantee. We did not record the playback state or library size for this snapshot.
Five Lessons From This Investigation
leaksshowing 0 leaks does not mean you don't have unwanted retention. Reachable objects insideCFNetwork, SwiftUI view caches, and growing catalog dictionaries all have valid pointers—leakswill bless them while your process footprint grows over an 18-hour session. Always inspectheap <PID>object counts alongsidevmmap -summary, and separate what is directly measured from what requires allocation backtraces.- SwiftUI's biggest hidden cost is eager modifiers and observation fan-out inside lists. A single unconditional
.popoveror.helpinside a table cell—or an eagerVStacknested inside aScrollView—multiplies across every row and leaves tens of megabytes ofAttributeGraphand malloc fragmentation behind. - Know your platform's inline string limit. On
arm64Swift, anyStringover 15 UTF-8 bytes (including every 22-byte Spotify ID and 36-byte URI) allocates on the heap. Interning shared identifiers and titles during catalog merge gives youfoobar2000-style deduplication for free via Swift's copy-on-write strings. - Use
PRAGMA mmap_sizein SQLite on macOS. Mapping read-heavy SQLite caches into Clean Page Cache while cappingPRAGMA cache_sizeprevents double-buffering in private dirty RAM. - Measure before rewriting your UI framework. You rarely need to abandon SwiftUI for the entire app—fixing lifecycle leaks, unmounting inactive GPU layers, interning model strings, and isolating
@Observablerow state solves the real bottlenecks in days instead of months.
The complete code and full investigation report (docs/RESEARCHES/2026-11-08_12-17_Kinrox-memory-reduction-research.md) are open in the repository:
- Website & Mac DMG download: https://kinrox.app/
- GitHub repository: https://github.com/awaik/Kinrox